Understanding the Where, When & Why of Micromobility Ridership
Cities know there is an infinite number of ways to turn data into knowledge, and knowledge into greater micromobility ridership. We’ve rolled out two new metric views within City Conductor to help zero in on the data that matters to drive real policy change:
Average Vehicle Miles Traveled: average distance of trips taken within a specified time period
Total Vehicle Miles Traveled: sum of the distances of all trips taken within a specified time period
These metrics provide cities with a new understanding of where, when, and why residents choose to make trips using micromobility. By leaning into those learnings, cities can develop strategies to help residents navigate the public right-of-way efficiently and safely, creating programs environmentally, socially, and financially sustainable for all stakeholders. More explicitly, our capabilities help cities to:
Calculate estimated reductions in greenhouse gas emissions, as residents embrace micromobility as a replacement for private automobiles on trips—a critical component of many cities’ climate change goals.
Reduce unsightly clutter and congestion by creating policies to accommodate a large influx of micromobility vehicles to a certain place at a certain time. Whether it’s downtown during the morning rush, or at the sports arena for a home game, moves like increased bike and scooter parking with drop zones or corrals help reduce strain on infrastructure.
Improve transportation equity by determining which neighborhoods have more vehicles leaving than arriving or staying. Understanding why they aren’t making the return trip lays the foundation for creating incentives for operators to increase deployment or rebalancing efforts to meet demand.
Prioritize improvements to the physical infrastructure, such as where to extend the bike lane network. Uncovering which origin/destination pairings occur most frequently can be used to, for example, build a case for a new protected bike lane.
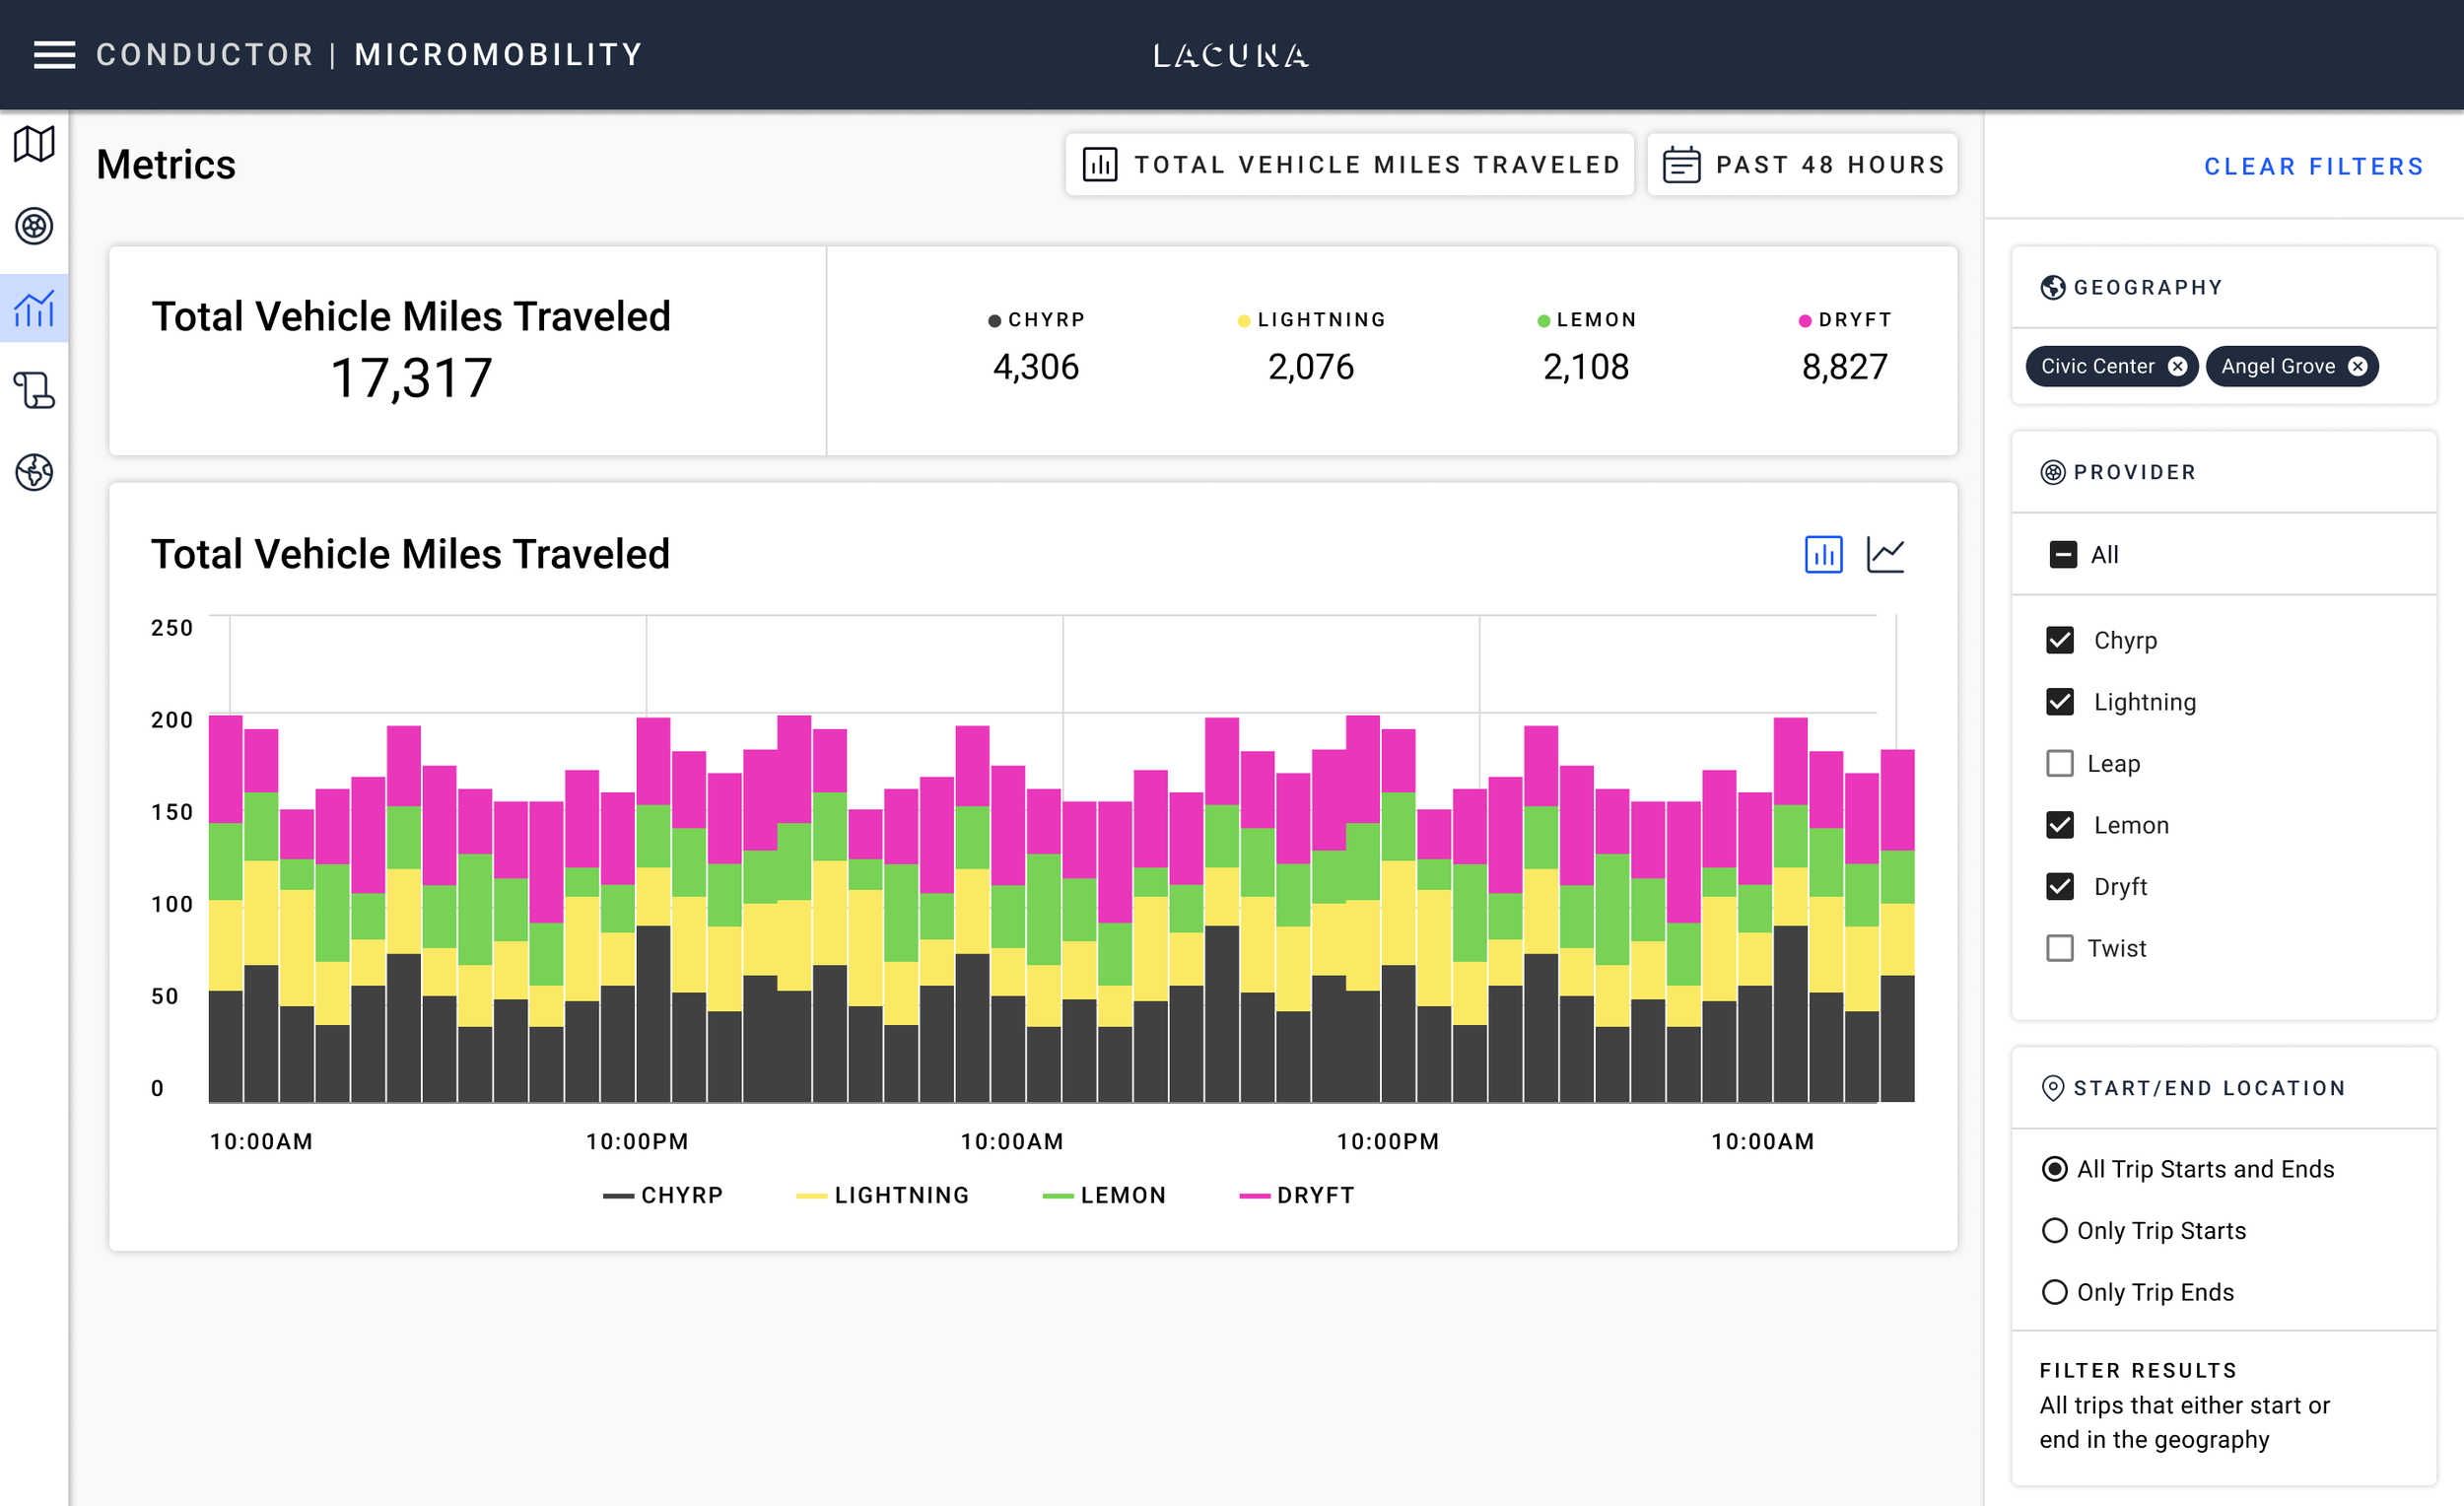
Located in the platform’s Metrics section, Average VMT and Total VMT enable City staff to see, in aggregate, how far riders travel when using bikeshare or dockless vehicles. Along with the existing metrics for Trip Counts, Event Counts, and Average Vehicles in State, these metrics provide powerful new ways for cities to understand how residents use micromobility to move from place to place.
Users can filter the data by geography, using pre-defined neighborhoods or geofences to focus on one particular area. They may also choose to view results by where trips start or where they end; which, when used in combination with the geography filter, describe how far riders travel when they start a trip in an area and how far they’ve traveled when they arrive at an area, respectively.
With the ability to filter and visualize historical data to the time period of the user’s choosing, cities can uncover new patterns in mobility and understand how ridership fluctuates with times of day, days of the week, or seasonally over the course of a year. For day-to-day operations, City Conductor provides near-real-time data, empowering staff with the kind of visibility that allows them to identify issues early and take timely action.
About City Conductor
City Conductor is Lacuna’s groundbreaking digital policy management platform. It empowers transportation agency staff with digital policy to manage, in real time, new and existing forms of commercial mobility activity that operate in the public right-of-way. The net result is leading-edge visibility, management, and governance of commercial activities to influence behavior and drive positive outcomes.